How to Track Your Money Using the 50/30/20 Rule Automatically
2026-03-01
How to Track Your Money Using the 50/30/20 Rule Automatically
The 50/30/20 rule is simple.
- 50% → Needs
- 30% → Wants
- 20% → Savings
But sticking to it?
That’s where most people struggle.
Because tracking requires:
Opening a spreadsheet.
Categorizing manually.
Calculating percentages.
Checking totals.
This guide shows how to use the 50/30/20 Spend Dashboard with Chat2Sheet so you can:
- Text your expenses or savings
- Automatically classify them as Wants, Needs, or Savings
- Instantly update your 50/30/20 dashboard
- See how close (or far) you are from your target ratios
If you’re new to conversational spreadsheet automation, start here:
→ How to Automate Data Entry into Spreadsheets via Text
Meet the 50/30/20 Spend Dashboard
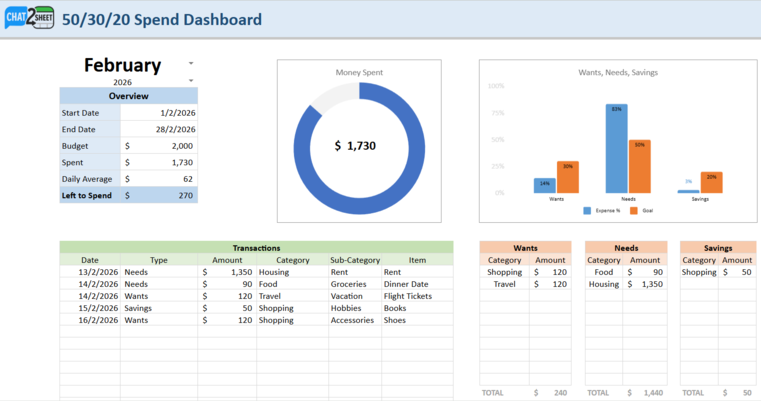
Here’s what the actual dashboard looks like:
This is not just an expense tracker.
It’s a goal-based spending system that includes:
- Month selector (February 2026 in this example)
- Budget summary (Budget, Spent, Daily Average, Left to Spend)
- Total Money Spent donut chart
- A visual Wants vs Needs vs Savings comparison chart
- A structured Transactions table
- Separate category summaries for Wants, Needs, and Savings
Everything is dynamically connected.
When you log one message, the entire dashboard updates.
How It Works: Text → Type Classification → Live Ratio Tracking
Instead of selecting dropdowns, you send messages like:
that concert ticket was $120 (def a want)
groceries was $90 yesterday
saved $300 today
moved $500 into savings
These messages are automatically converted into structured entries like this:
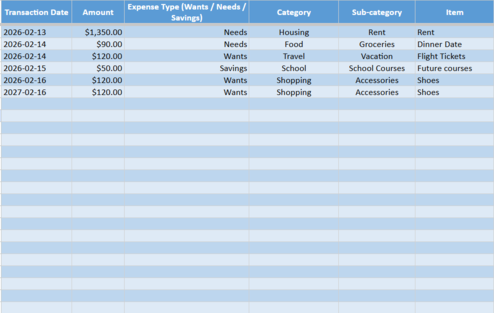
Notice the key column:
Expense Type (Wants / Needs / Savings)
Chat2Sheet intelligently classifies:
- Rent → Needs
- Groceries → Needs
- Concert tickets → Wants
- Transfers to savings → Savings
The result is clean, structured data powering your dashboard.
No manual tagging required.
The Dashboard Shows You If You’re On Track
From the screenshot example:
- Budget: $2,000
- Spent: $1,730
- Left to Spend: $270
But the powerful part is the Wants/Needs/Savings comparison chart.
It shows:
- Actual % spent in each bucket
- Goal % (50 / 30 / 20)
- Visual comparison between the two
For example:
- Needs may be at 83%
- Goal is 50%
- Wants may be lower than target
- Savings may be below 20%
This immediate visual gap is what drives behavior change.
You don’t just see spending.
You see alignment (or misalignment) with your goals.
How to Use the 50/30/20 Dashboard
Step 1: Set Your Monthly Budget
In the Dashboard tab:
- Select your month
- Enter your total monthly budget
- Confirm start and end dates
The system automatically calculates:
- Target allocation for Needs (50%)
- Target allocation for Wants (30%)
- Target allocation for Savings (20%)
Step 2: Link the Sheet to Chat2Sheet
Once linked, every text you send:
- Creates a new transaction row
- Assigns Wants / Needs / Savings
- Categorizes the expense
- Updates all charts automatically
Step 3: Log Naturally (Like You Normally Text)
Here are examples from the demo images:

Examples:
saved $300 today
that concert ticket was $120 (def a want)
groceries was $90 yesterday
moved $500 into savings
Pro tip:
You don’t need to type dates. Chat2Sheet adds that automatically.
Why the 50/30/20 Version Is Different
A normal expense tracker answers:
“How much did I spend?”
This dashboard answers:
“Am I spending in alignment with my life goals?”
That shift matters.
Because you can:
- Overspend on Wants but still hit total budget
- Underfund Savings without realizing it
- Let Needs quietly dominate your month
The bar chart makes that imbalance obvious immediately.
Best Practices for 50/30/20 Logging
Be explicit when needed
If something is clearly discretionary, you can say:
- “concert ticket $120 (want)”
- “new shoes $80 want”
But most of the time, the AI will infer correctly.
Log savings transfers intentionally
Examples:
saved $200moved $500 into savingstransferred $300 to emergency fund
Savings entries are just as important as expenses.
Review weekly — not monthly
Check your dashboard mid-month.
If Needs are already at 70%:
- Reduce discretionary spend
- Increase savings transfers
- Delay large purchases
Small corrections keep you aligned.
Extend This System Further
Once your 50/30/20 tracking is running, you can:
-
Separate business expenses into another sheet →
How to Manage Multiple Google Sheets from a Single Chat -
Log hands-free using voice notes →
How to Update Google Sheets Using Only Your Voice -
Set everything up in under two minutes →
Ultimate Setup Guide
This turns the 50/30/20 rule into a real-time financial control system.
Final Thoughts
The 50/30/20 rule only works if you can see it clearly.
With this dashboard:
- Every text updates your ratios
- Every expense shifts your alignment
- Every savings transfer moves you closer to your target
No manual math.
No end-of-month surprises.
No spreadsheet friction.
Just one message
—and a live 50/30/20 dashboard updating instantly.
To understand the bigger shift toward conversational spreadsheet automation, read:
→ How to Automate Data Entry into Spreadsheets via Text
Ready to Track Wants, Needs, and Savings Automatically?
Stop guessing if you’re following 50/30/20.
Start texting your money decisions
—and let your dashboard show you the truth in real time.