How to Track Personal Expenses Automatically with a Simple Dashboard
2026-03-01
How to Track Personal Expenses Automatically with a Simple Dashboard
Most people don’t fail at budgeting because they lack a spreadsheet.
They fail because logging expenses is annoying.
Open the sheet.
Find the right tab.
Enter the date.
Choose a category.
Repeat.
This guide shows how to use the Simple Personal Expenses Tracker Dashboard with Chat2Sheet so you can:
- Text your expenses
- Automatically update a structured Transactions table
- Instantly refresh charts and breakdowns
- Track budget vs actual in real time
If you’re new to conversational spreadsheet automation, start here:
→ How to Automate Data Entry into Spreadsheets via Text
Meet the Simple Personal Expenses Dashboard
Here’s what the actual dashboard looks like:
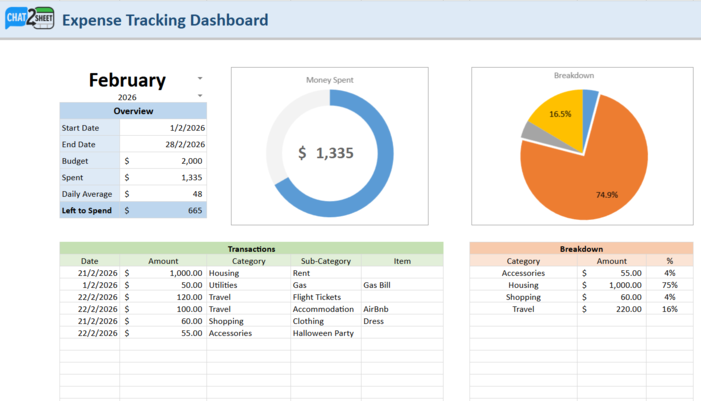
This is not just a spreadsheet.
It’s a fully linked dashboard that includes:
- Month selector (February 2026 in this example)
- Budget overview (Start Date, End Date, Budget, Spent, Daily Average, Left to Spend)
- A live Money Spent donut chart
- A Category breakdown pie chart
- A structured Transactions table
- A dynamic Category breakdown summary
Every section updates automatically when new expenses are logged.
How It Works: Text → Structured Data → Live Dashboard
Instead of typing directly into rows, you simply send messages like:
Spent $1000 on rent for February yesterday
Paid $50 for gas bill
Spent 120 for flight tickets for my vacation
Spent $60 on shopping for a dress yesterday
Those messages are converted into structured entries like this:
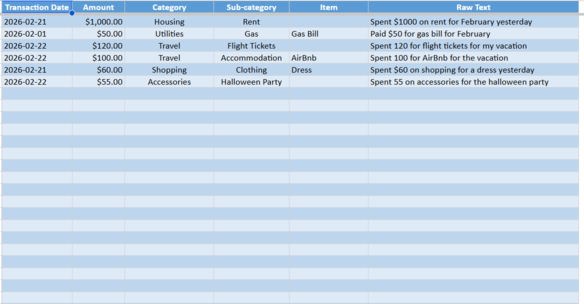
Notice what happens automatically:
- The Transaction Date is extracted (even from words like “yesterday”)
- The Amount is parsed
- The Category is intelligently assigned (Housing, Travel, Shopping, etc.)
- The Sub-category is mapped (Rent, Flight Tickets, Clothing)
- The original message is stored in Raw Text for traceability
You never manually touch a row.
The Dashboard Updates Instantly
Once transactions are logged, the top-level dashboard updates in real time.
From the screenshot:
- Budget: $2,000
- Spent: $1,335
- Left to Spend: $665
- Daily Average: $48
The donut chart visually shows total spend progress.
The pie chart shows category distribution:
- Housing ~75%
- Travel ~16%
- Shopping ~4%
- Accessories ~4%
This is powered entirely by the structured Transactions table below it.
No manual formulas to update.
No refreshing required.
How to Use the Simple Personal Expenses Tracker
Step 1: Set Your Monthly Budget
In the Dashboard tab:
- Select your Month
- Enter your Budget amount
- Confirm Start and End dates
Everything else calculates automatically.
Step 2: Link the Sheet to Chat2Sheet
Once linked, every text you send will:
- Create a new row in the Transactions table
- Auto-fill category and sub-category
- Stamp the correct date
- Trigger all dashboard calculations
Step 3: Start Logging Naturally
Here are real examples (from the demo images):
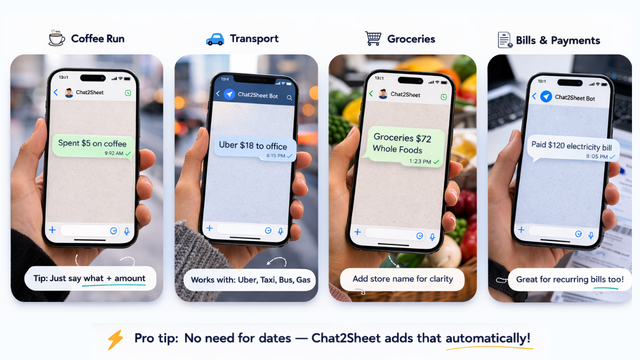
Examples:
Spent $5 on coffee
Uber $18 to office
Groceries $72 Whole Foods
Paid $120 electricity bill
Pro tip:
You don’t need to type the date. Chat2Sheet adds that automatically.
Why This Dashboard Is Powerful
This isn’t just expense logging.
It’s a closed feedback loop:
- You text an expense.
- The transaction is structured.
- Your monthly dashboard updates.
- You instantly see budget impact.
That visibility changes behavior.
When you see:
- Daily average rising
- “Left to Spend” shrinking
- Housing dominating your breakdown
You make smarter decisions in real time.
Best Practices for This Simple Expense Tracker
Keep messages short and clear
Good examples:
Spent $60 on groceriesUber $22 to airportPaid $95 internet bill
No need for perfect grammar.
Let the AI handle categorization
The dashboard already includes common categories like:
- Housing
- Utilities
- Travel
- Shopping
- Accessories
You don’t need to manually select anything.
Review the dashboard weekly
Instead of waiting until month-end:
- Check the donut chart mid-month
- Monitor “Left to Spend”
- Watch your Daily Average
Small course corrections > big surprises.
Extend This System Further
Once you’re comfortable with the Simple Personal Expenses Tracker, you can:
-
Route business expenses to a separate sheet →
How to Manage Multiple Google Sheets from a Single Chat -
Log entries hands-free via voice →
How to Update Google Sheets Using Only Your Voice -
Set everything up in under two minutes →
Ultimate Setup Guide
This transforms a simple tracker into a real-time financial command center.
Final Thoughts
Most budgeting systems fail because they depend on discipline.
This one depends on conversation.
You already text every day.
Now those messages:
- Become structured financial records
- Power live visual dashboards
- Keep your monthly budget visible at all times
One message.
One expense.
One instantly updated dashboard.
To understand the bigger shift toward conversational spreadsheet automation, read:
→ How to Automate Data Entry into Spreadsheets via Text
Ready to Turn Text Messages into a Live Expense Dashboard?
Stop manually updating spreadsheets.
Start texting your expenses
—and let your dashboard update itself.